
Studio13
2.4X monthly revenue · 61% of paid revenue from Google · ₹82.4L in 12 months.
Last updated: July 2026
/ Results at a glance
2.4X
Monthly revenue growth
61%
Of paid revenue from Google
₹82.4L
Revenue in 12 months
/ The brief
A design-led brand's first paid media bet
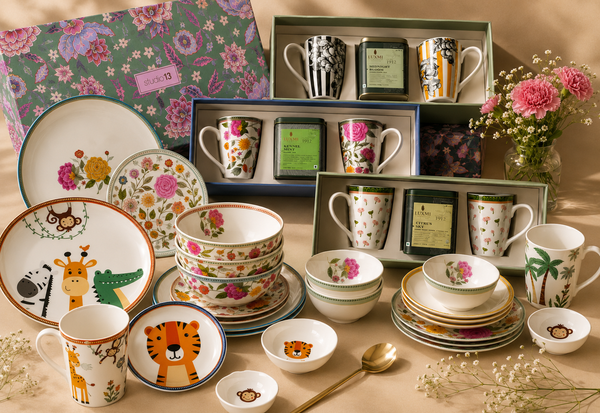
Studio13 — a homegrown ceramics and tableware brand — had never run paid media. Their products were selling on the strength of the brand itself, and when they decided to put money behind it, the assumption was straightforward: Meta is where our customers are, so Meta is where we spend. Everything else felt like a distraction.
It's a reasonable assumption for a visual, design-led brand. It just wasn't the full picture.
"Meta is where our customers are, so Meta is where we spend."
The starting assumption
/ What we found
Real demand, unbid on
We started on Meta, because that part of the instinct was right — it built awareness, it made the catalogue discoverable, and it gave us fast creative feedback. But while we were scaling it, we kept looking at what people were typing into Google.
There was real, consistent demand for exactly what Studio13 sells — dinnerware, gift sets, kids' sets, stationery — and the brand wasn't showing up for any of it.
Nobody had claimed that demand. It was sitting there, unbid on.
/ What we did
Built Google out as a system, not a test
Meta kept doing what it does best — discovery and creative testing — and became the thing that created the searches Google then closed. Around it, we built four channels, each with a specific job.
Meta
Discovery & creative testing
Built awareness, made the catalogue discoverable, gave fast creative feedback. Created the searches Google then closed.
Performance Max
Algorithmic scale
Fed product and audience signal across the full catalogue so Google could match the right SKU to the right shopper.
YouTube
Top of funnel
Carried the story and warmed up cold demand for people not yet searching for Studio13 by name.
Google Search
Purchase intent capture
Caught people already typing dinnerware, gift sets, kids' sets, stationery. The demand nobody was bidding on.
Alongside it, we built the creative engine around what the data rewarded: collection-led video, carousels for the gifting range, and category campaigns split so budget followed margin instead of assumption.
Campaign 01
Gifts & Stationery
Occasion-led, highest AOV in peak weeks
Campaign 02
Dinnerware
Core catalogue, steady margin
Campaign 03
Kids
Distinct buyer, distinct creative
/ What happened
The numbers moved
Monthly revenue moved from roughly ₹5L to ₹12L. Google went from 4 orders a month to 98, and from under 10% of paid revenue to 61% of it.
Before → After
Monthly revenue (₹ lakh)
Google share of paid revenue
Before · Google orders / month
4
After · Google orders / month
98
| Metric | Before | After | Change |
|---|---|---|---|
| Monthly revenue | ₹5L | ₹12L | 2.4X |
| Google orders / month | 4 | 98 | 24.5X |
| Google share of paid revenue | <10% | 61% | +51 pts |
| 12-month revenue | — | ₹82.4L | New floor |
Meta was never the wrong answer. It just wasn't the only one.